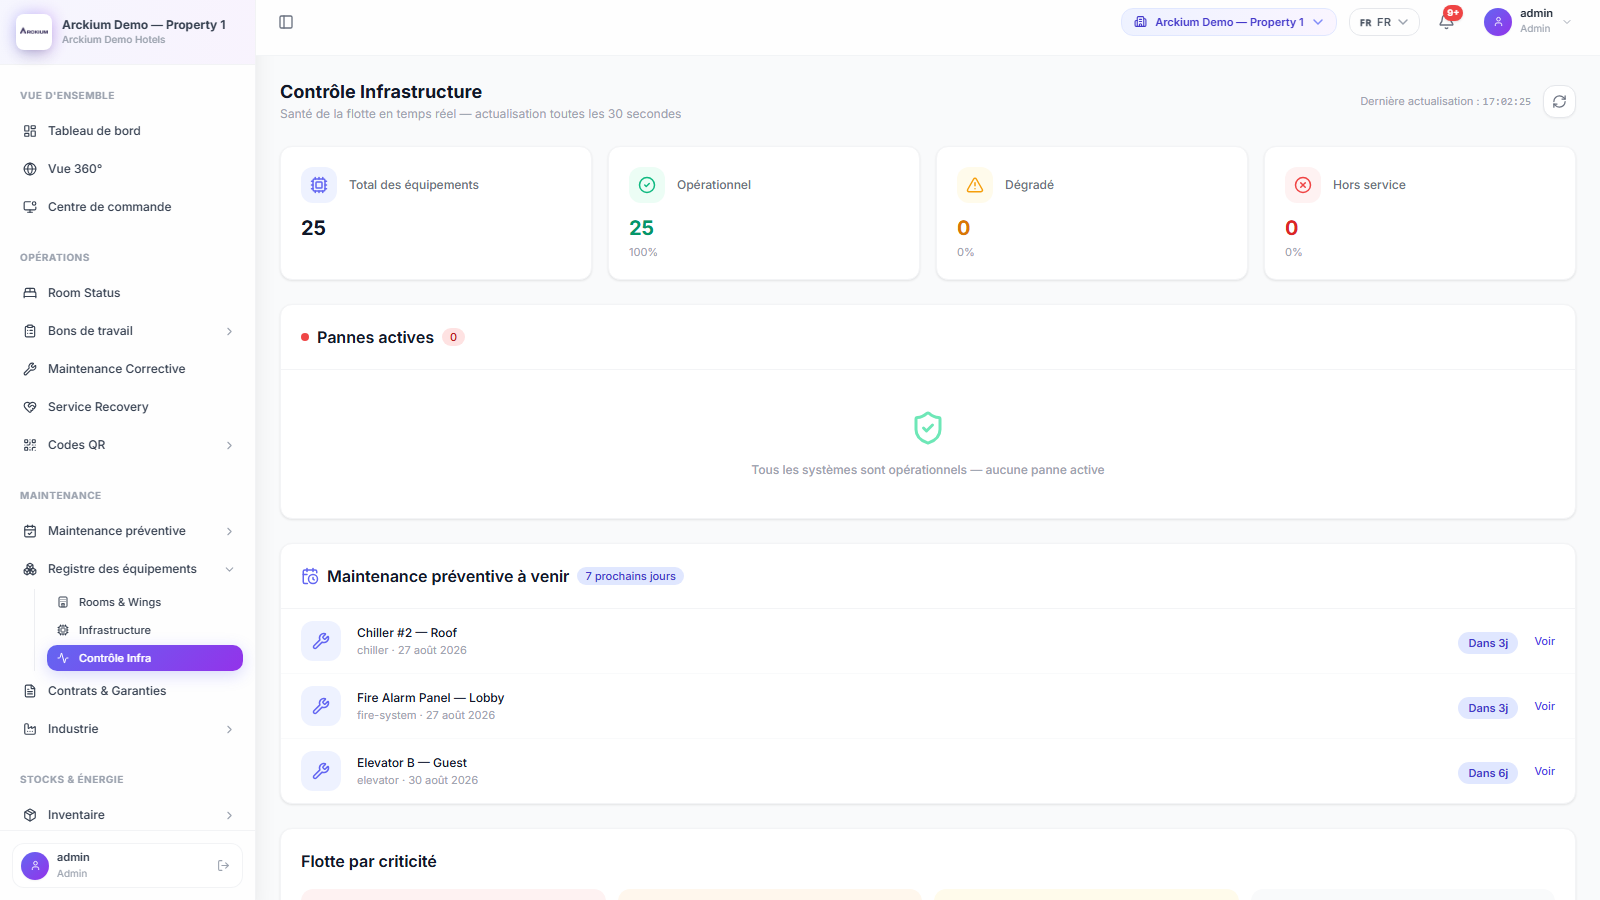
- 3
- Operational states
- MTBF
- Per asset
- Live
- Outage clock
- Any depth
- Asset tree
Everything you need. Nothing you don't.
Site, line, machine, component
Parent and child relationships you can re-arrange when the plant changes, because the tree is data.
Degraded is its own state
Operational, degraded and out of service are tracked apart. Degraded is the one that predicts the next stop.
The clock starts at the stop
An outage records when and why, with its work order, and counts up for as long as it stays open.
Critical assets do not queue
Anything flagged critical is counted and surfaced on its own.
Reliability as a number
Mean time between failures per asset, aggregated across the site.
The dashboard is the same data
Asset states, critical counts, open jobs and this month's completions, straight from the records the floor updates.
How it works
- 01
Model the plant
Create the assets and set their parents until the tree matches the floor, line by line.
- 02
Flag what stops production
Criticality is what gives prioritisation something to work with.
- 03
Log outages on the asset
It opens with a reason and a work order, and the clock starts on its own.
- 04
Read it in one place
Active outages, degraded assets, critical counts and completion rates.
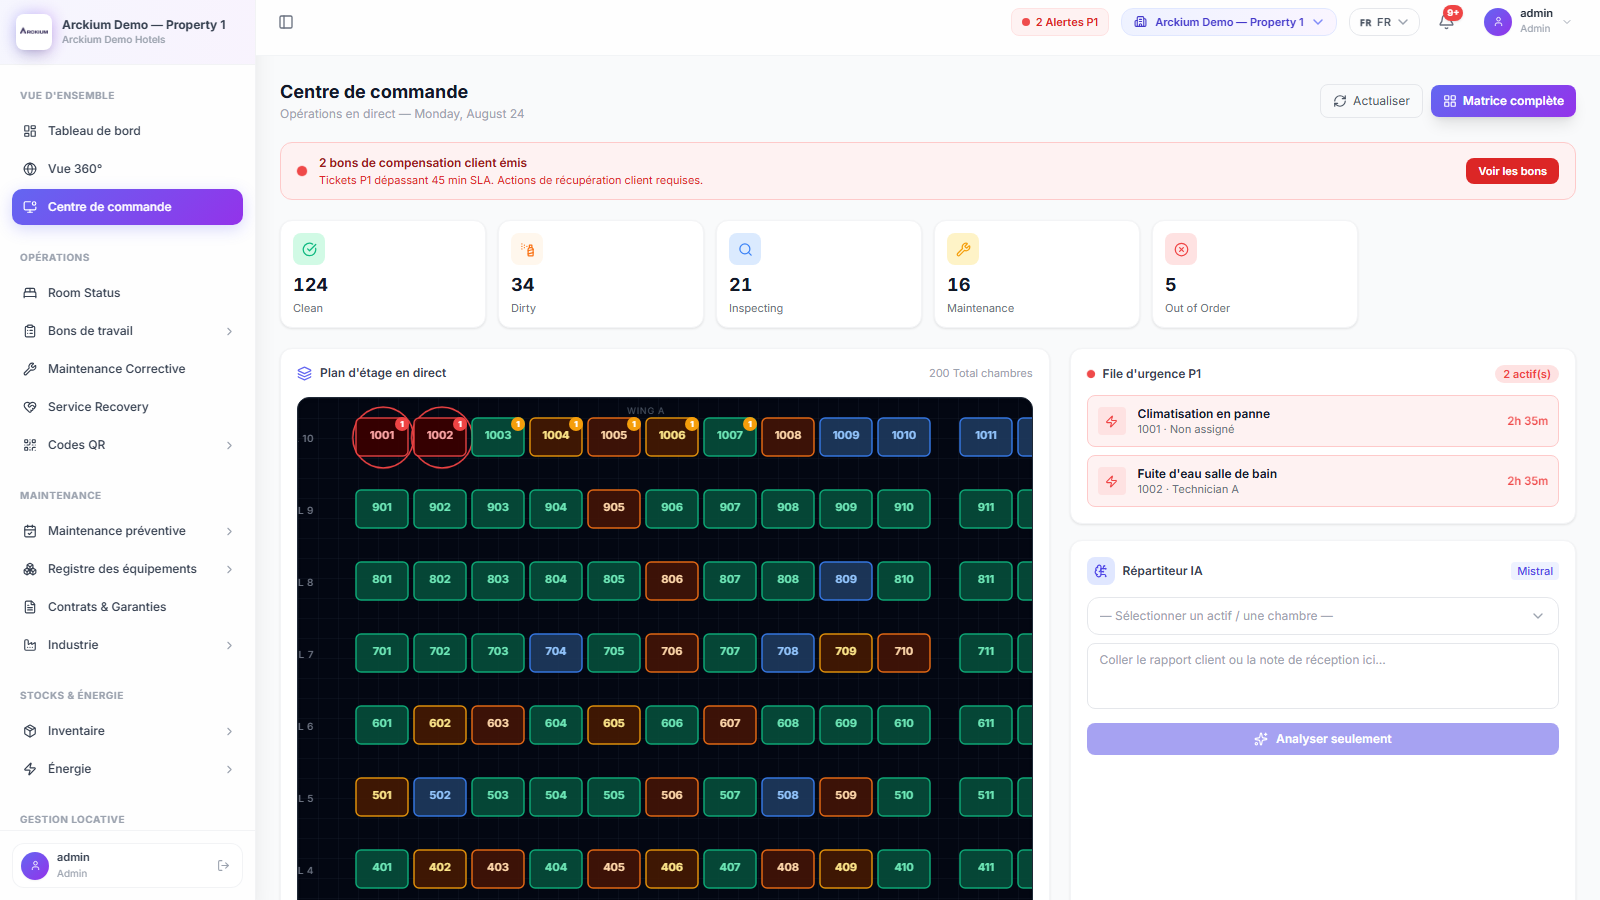
Connects with the rest of Arckium
Every module is designed to work together: data flows automatically, no sync required.