- 5
- Rules that open work orders
- 7
- KPI building blocks
- 12
- Months per occupancy band
- PDF + XLSX
- Monthly reports
Everything you need. Nothing you don't.
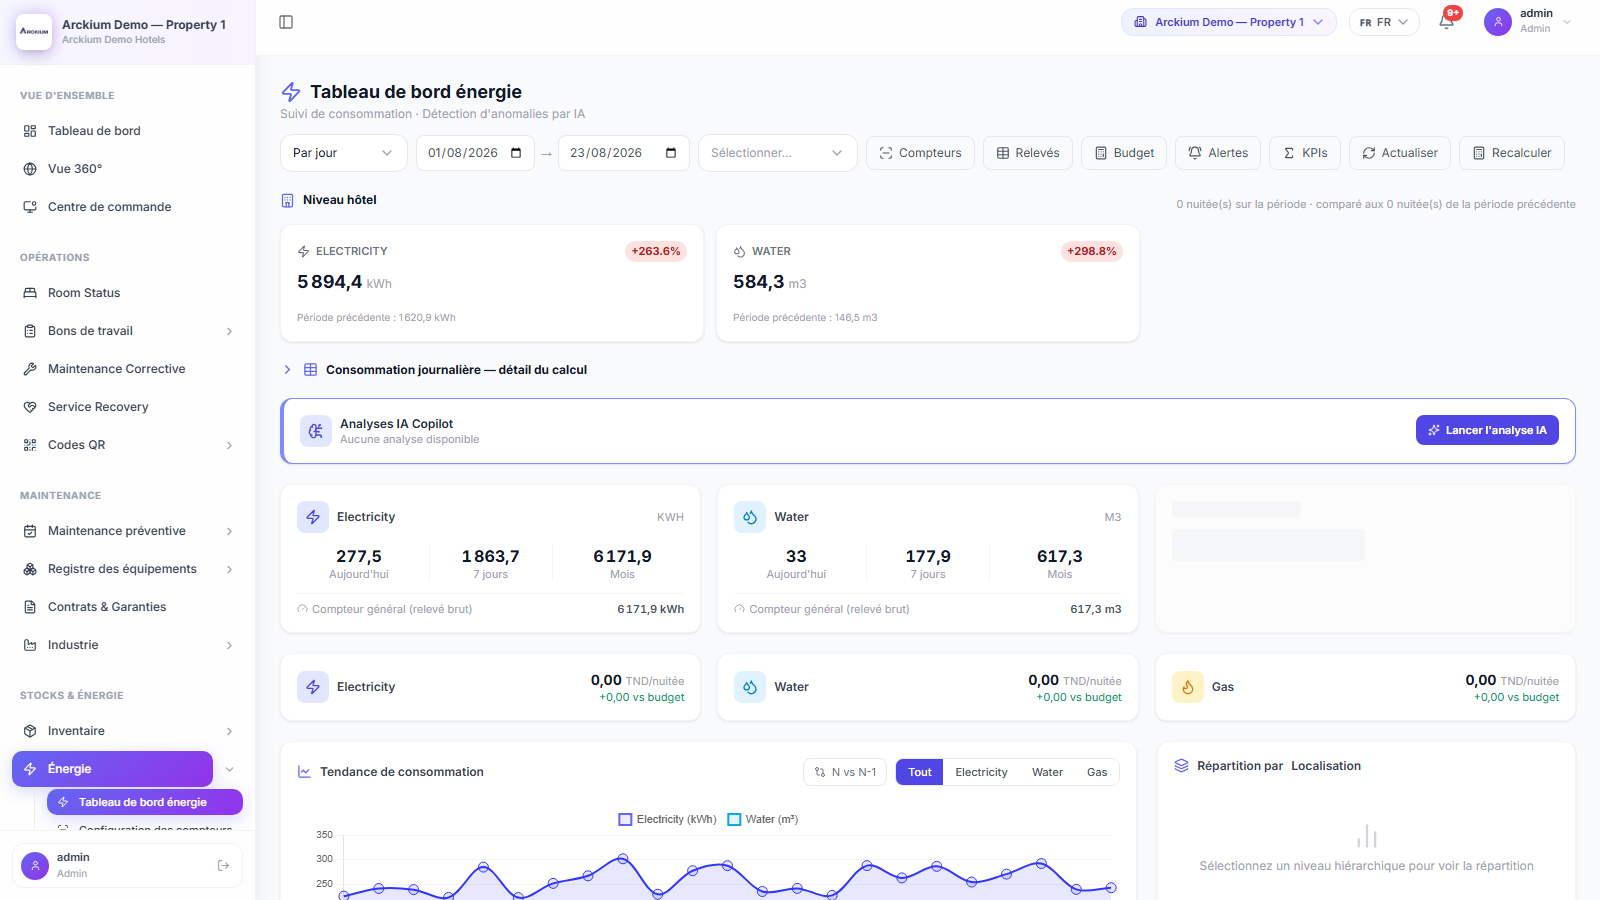
Sub-meters that actually add up
Child meters are subtracted from their parent automatically, so a floor never gets counted twice. Every KPI picks what it reads: net after children, the meter's own delta, or the raw index off the counter face.
Build the KPI your auditor asks for
Compose formulas from meters, guest-nights, coefficients, tariffs, constants and other KPIs. It is a structured definition, not a formula string, so there is nothing to inject into.
Compare like for like
A quiet Tuesday is not an efficiency win. Divide any metric by guest-nights from your PMS, by floor area, by covers served, or by kilos of laundry.
Rates never get summed by accident
A week at 2.4 kWh per guest-night is not 16.8. Ratios divide once per period, and prices and coefficients carry their last value forward.
A budget your technical director signed
Occupancy bands by month, one coefficient set per metric. The budget engine ignores the matrix until someone marks it validated.
Price changes that do not rewrite history
A gas price change in June reprices June onward, not January. Tariffs carry validity dates plus fixed monthly charges and percent-of-energy components.
Five things that trigger a work order
Stuck meter. Regressive index. Suspected leak. Consumption drift. Missing reading. Each has its own thresholds and priority, and each lands as a real job with an owner.
Photograph the dial, keep the round
The reading is pulled off the photo, so the walk your technician already does becomes the data source.
Bring the years you already have
CSV and XLSX templates, an importer for the old Excel workbooks, and a webhook for meters that report themselves.
How it works
- 01
Map the meter tree
Declare your meters and say which one sits under which. Netting and zone breakdowns follow from that.
- 02
Feed it readings
Type them in, photograph the dial, import a spreadsheet, or let the meters post to a webhook.
- 03
Set coefficients and tariffs
Load the occupancy bands, get them validated, enter your price periods. Budget, variance and cost follow.
- 04
Let it run
Anomalies become work orders, the month gets summarised, and the report is one click when finance asks.
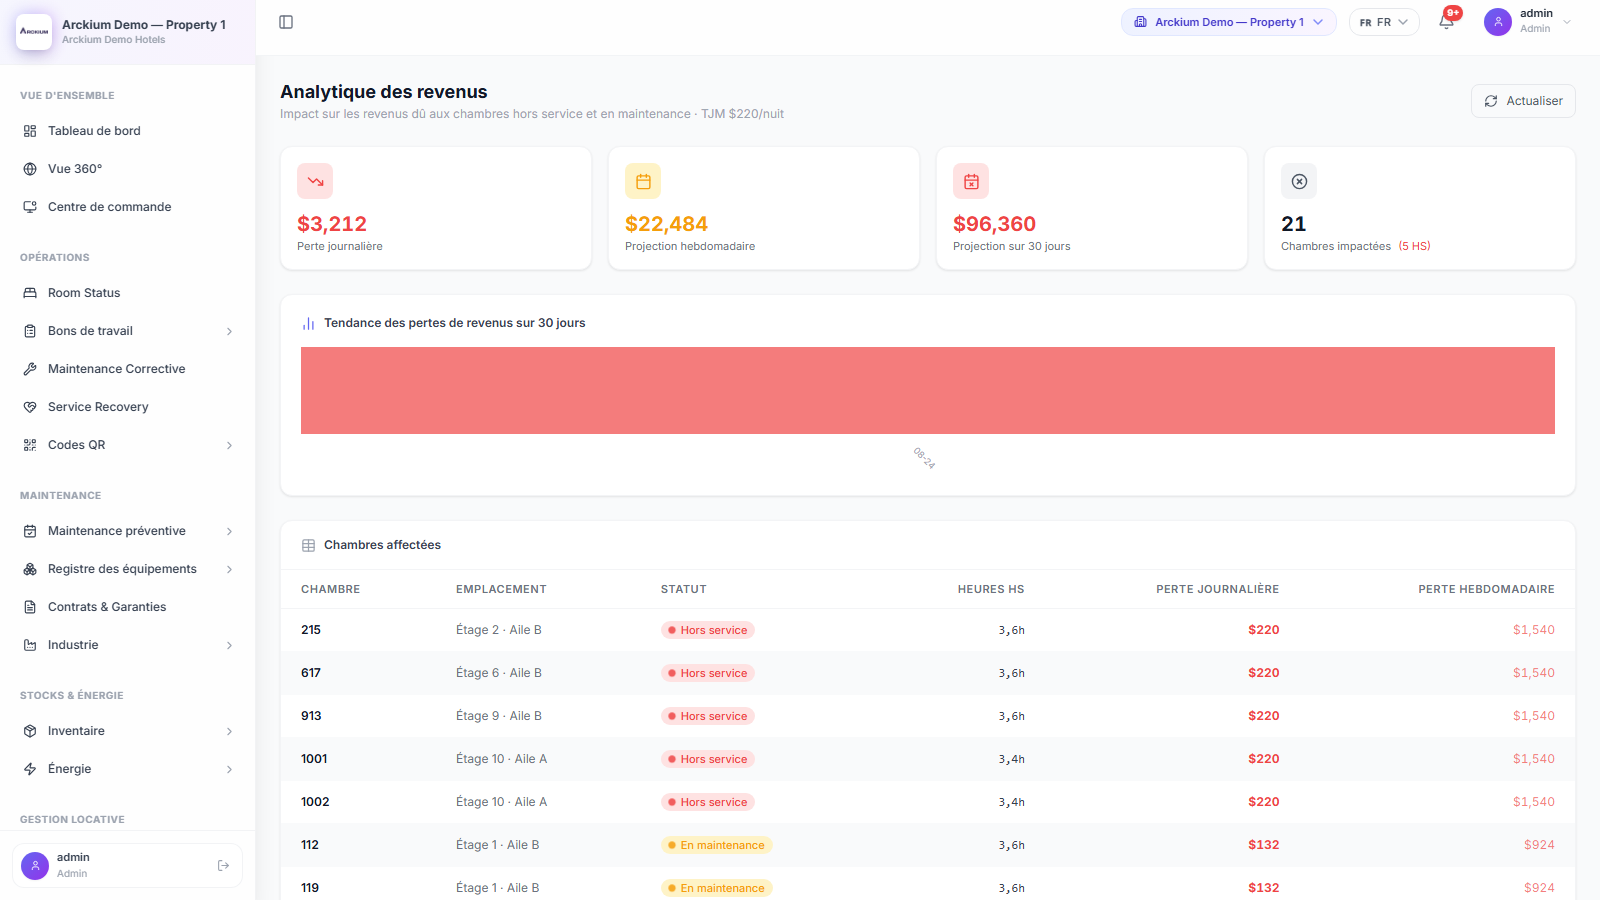
Connects with the rest of Arckium
Every module is designed to work together: data flows automatically, no sync required.